Introduction
This website began as a personal project to analyze climate trends in Denver, Colorado, where I live. I wanted to understand how global warming was affecting my local area.
After creating the initial Denver climate analysis, I became interested in expanding the project to other regions of the country to compare how different areas are experiencing climate change. This led to the creation of the Seattle climate analysis section, which uses data from the Sea-Tac weather station.
The data for this analysis comes from two primary sources: the National Weather Service (NWS) and the National Oceanic and Atmospheric Administration (NOAA). We use data from 1948 to the present, with the 30 year windows making up the "normal" climate baseline. This is why our plots and statistics begin in 1978, allowing us to compare current conditions against this established baseline.
I found that many climate websites focus on either current weather or future projections, but there were fewer resources showing clear, easy-to-understand visualizations of historical climate trends. By creating these visualizations, I hope to make climate data more accessible and help people understand how their local climate is changing over time.
Temperature Trends in Seattle
Average yearly temperatures in Seattle over the past several decades:
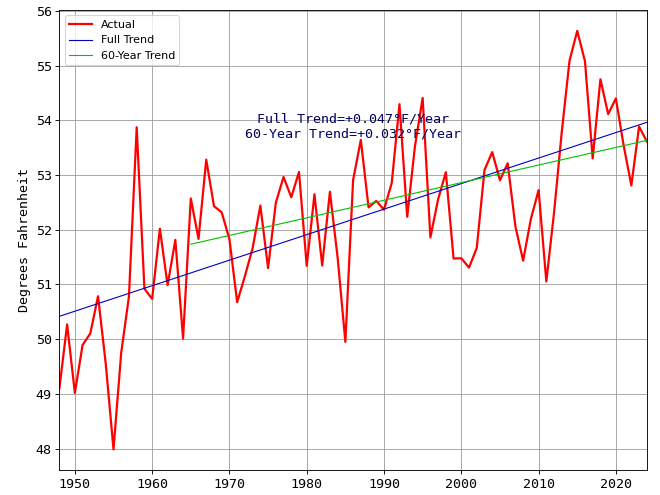
The data shows a clear warming trend in Seattle's climate. While the average temperature varies from year to year, the overall trajectory is upward. The plot includes a linear fit for all years from 1978 to present and also includes a linear fit for the last 60 years, showing the temperature trend in degrees per year. Even small increases in average temperature can have significant impacts on Seattle's ecosystem and weather patterns, potentially leading to more extreme heat events and changes in precipitation patterns.
Precipitation Trends in Seattle
Total yearly precipitation in Seattle over the past several decades:
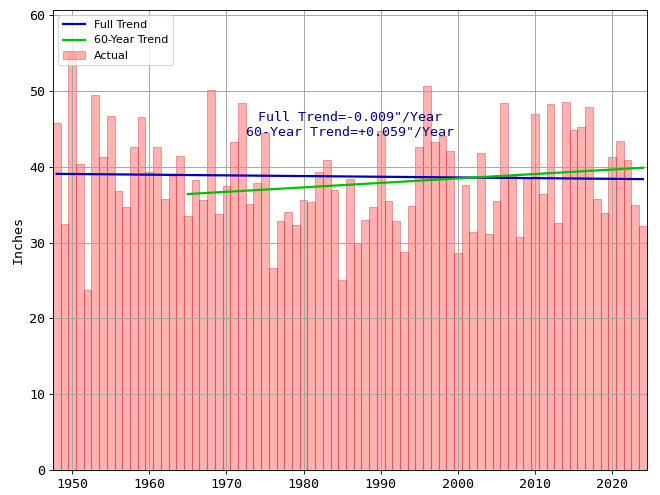
Seattle's precipitation patterns show interesting variations over time. While the city is known for its rainy reputation, the yearly totals can vary significantly. Some years experience above-normal precipitation, while others fall below the average. This variability is particularly important for Seattle's water resources, ecosystem health, and urban infrastructure. The data helps us understand how climate change might be affecting the region's characteristic wet climate and what that means for the future of the Pacific Northwest.